
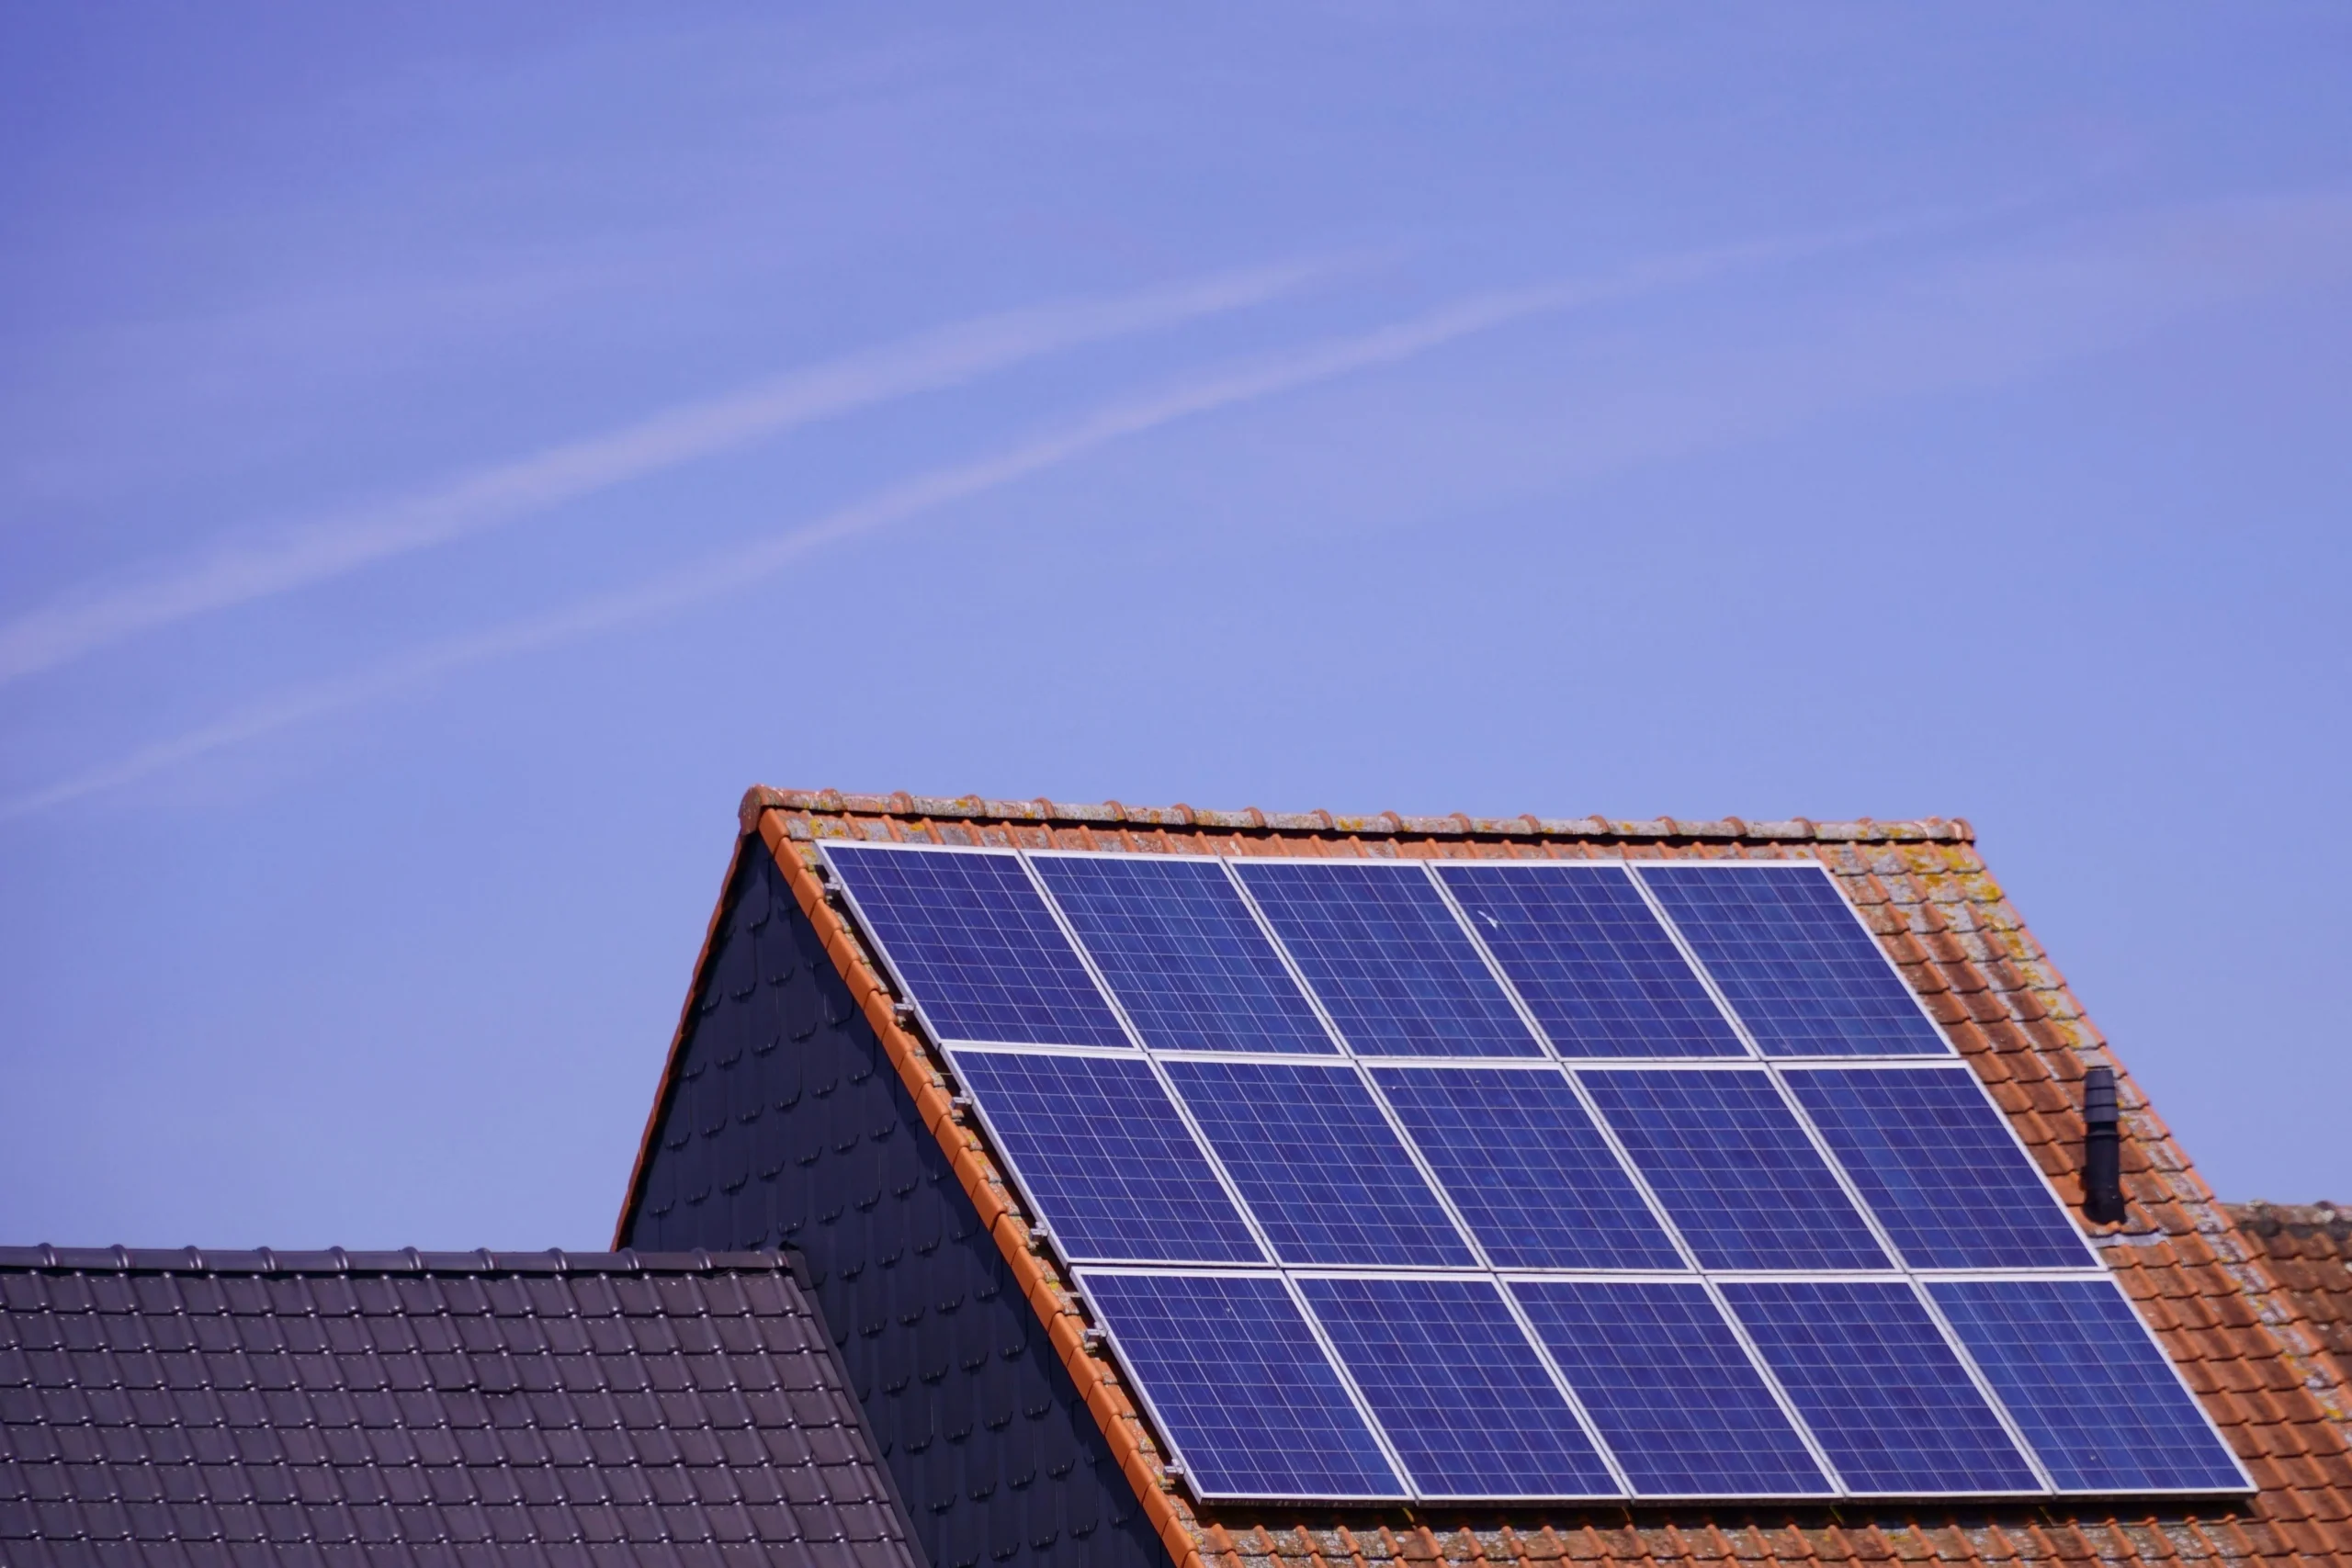

As electricity prices keep climbing across the country, homeowners are looking for real ways to take control of their monthly bills. Solar has come a long way from being a niche green option, but is solar power worth it in 2026 now that the financial landscape has genuinely shifted?
Here’s the honest answer: it depends more on your state and utility than it did even a year ago, mainly because of one major federal change most homeowners haven’t caught up on yet.
Table of Contents
The Federal Tax Credit Situation Has Changed
If you’ve seen “30% off with the federal tax credit” recently, it’s outdated information. The Residential Clean Energy Credit, the 30% credit homeowners have relied on for years expired for homeowner-purchased systems (whether paid in cash or financed with a loan) placed in service after December 31, 2025, under the One Big Beautiful Bill Act signed into law in July 2025.
Practically, that means a $20,000 system that would have effectively cost $14,000 after the old credit now costs the full $20,000. National payback periods have shifted accordingly, from the roughly 6-8 years homeowners got used to, to a more realistic 8-14 years depending heavily on your state’s electricity rates and net metering policy.
There’s one exception worth knowing: if you lease your system or sign a Power Purchase Agreement instead of buying it outright, the third-party owner of the system may still access a separate commercial credit and could pass some savings through as a lower monthly rate not the same as owning the credit yourself, but a real option worth comparing if this change affects your math.
What Solar Actually Costs in 2026
With the credit gone, the sticker price is now the effective price for most homeowners, so it’s worth understanding it clearly. National average installed cost runs roughly $2.50-$3.30 per watt.
For a standard 10kW system, sized for a typical American home, that breaks down roughly like this:
| Item | Estimated Cost |
|---|---|
| Equipment (high-efficiency panels & inverters) | $12,000–$15,000 |
| Installation & labor (permits, engineering) | $5,000–$8,000 |
| Total out-of-pocket (2026, no federal credit) | $17,000–$23,000 |

Several factors explain the range within that total: a steep or complex roof increases labor time and cost; your state affects permit fees and installer competition (Texas and Florida often price differently than the Northeast); and panel quality matters, since premium Tier 1 panels cost more upfront but typically produce more energy over time, especially in lower-light conditions.
Net Metering: Where the Real Savings Now Live
With the federal credit gone, state-level policy carries more of the weight in determining your actual payback period than it used to.
Net metering is the arrangement with your utility (PG&E in California, Oncor in Texas, and similar providers elsewhere) where excess power your panels generate during the day gets credited back to you, effectively running your meter backward. Some states are shifting to “net billing” instead. California’s NEM 3.0, in effect since 2023, cut export compensation by roughly 75%, making a home battery far more important for capturing value from your own excess production rather than selling it back cheaply.
Beyond net metering, many states offer additional incentives worth checking. New Jersey and Massachusetts, for example, offer Solar Renewable Energy Certificates (SRECs), paying homeowners an ongoing amount per unit of clean energy generated genuinely worth a few hundred dollars a year in the right state. Checking your state’s specific programs, rather than assuming a one-size-fits-all national picture, is worth the time before deciding.
The Payback Period: When You Actually Profit
Solar is a long-term investment, not a quick win, and it’s worth setting that expectation honestly upfront. For a standard 10kW system in a consistently sunny state like Arizona or Florida, expect to break even in roughly 8-11 years without the federal credit. In states with higher electricity rates, like Hawaii or Connecticut, or strong state-level incentive stacking, like Massachusetts, payback can still land toward the faster end of that range.
Here’s the basic savings math: if you currently pay $150 a month for electricity, that’s $1,800 a year. Utility rates have historically risen roughly 3-5% annually, meaning your solar savings aren’t just a flat $1,800 a year, they grow as grid electricity gets more expensive, while your own generation cost stays fixed. Over a panel’s typical 25-year warrantied lifespan, that compounding effect is where the bulk of the real financial benefit accumulates, particularly in the later years.
The Home Value Question
Solar’s effect on resale value is genuinely well-documented, though the exact number varies depending on which study you check. Zillow’s widely-cited 2019 analysis found homes with solar sell for 4.1% more on average than comparable homes without it. A more recent 2025 study by SolarReviews, using updated data and replicating Zillow’s methodology, found an even larger 6.9% average premium though this varies significantly by state, with a few states showing minimal or even negative premiums in that same study.
Separately, Lawrence Berkeley National Laboratory research indicates buyers pay roughly $4 per watt of installed capacity in California and about $3 per watt in other states, meaning a typical 8kW owned system could add somewhere between $24,000 and $32,000 in perceived value, a different way of measuring the same underlying effect as the percentage figures above.
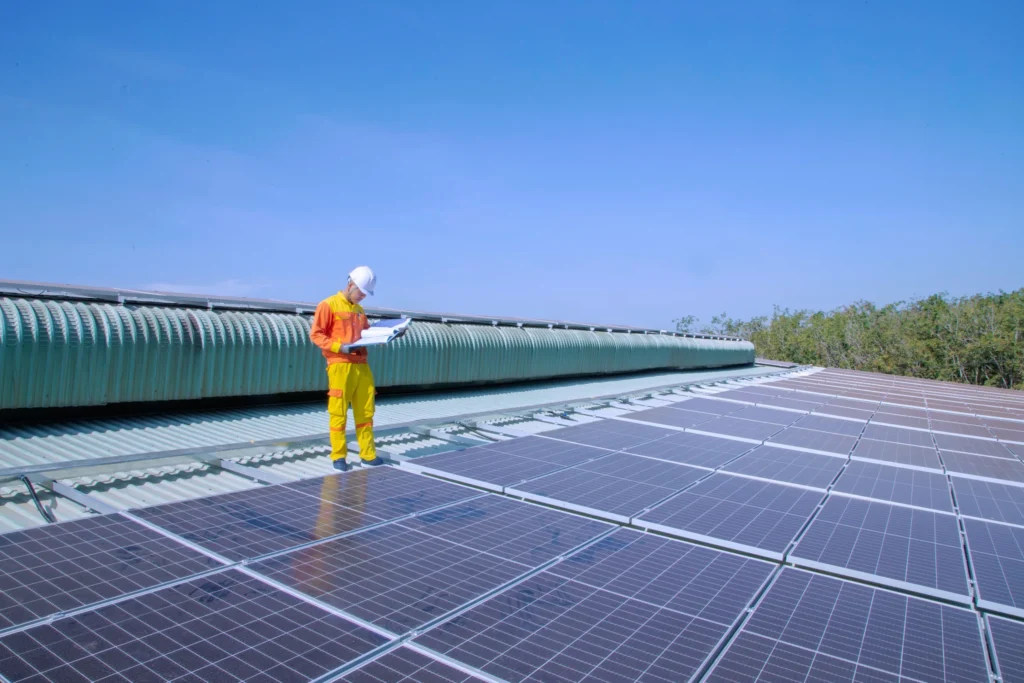
Comparison Table: Solar Economics Before vs. After the Tax Credit Change
| Factor | With Federal Credit (Pre-2026) | Without Federal Credit (2026 Onward) |
|---|---|---|
| Typical System Cost (10kW) | $17,000–$23,000, minus 30% credit | $17,000–$23,000, full cost |
| Effective Net Cost | ~$12,000–$16,000 | $17,000–$23,000 |
| Typical Payback Period | 6–8 years | 8–14 years (state-dependent) |
| What Still Helps | Federal credit + state incentives | State incentives, SRECs, net metering only |
This table reflects the national policy shift as of 2026; your specific numbers depend heavily on your state’s net metering rules and any remaining state-level incentives.
Is the Switch Right for You in 2026?
Solar remains a genuinely strong decision for a lot of homeowners, just a more state-dependent one than it was before. If you’re planning to stay in your home for at least 8-10 years, live somewhere with good sun exposure, and your state offers reasonably strong net metering or additional incentive programs, the numbers still work in your favor over the system’s lifetime.
If you’re in a state with weak net metering, a low electricity rate, or you’re planning to move within the next several years, the math is genuinely harder now than it was with the federal credit in place, and it’s worth running the numbers carefully or considering a lease/PPA arrangement instead before committing.
Frequently Asked Questions
No, not for homeowner-purchased systems. It expired for systems placed in service after December 31, 2025. Only third-party-owned systems (leases and PPAs) may still have credit eligibility, claimed by the system’s owner rather than the homeowner directly.
Typically $17,000-$23,000 out of pocket before any state-level incentives, based on a national average of $2.50-$3.30 per watt installed. Without the federal credit, this is now close to the effective final cost for most buyers.
Nationally, 8-14 years without the federal tax credit, varying significantly by state. Sunny, high-electricity-rate states with strong net metering can still see 8-11 year paybacks; weaker-incentive states may run longer.
Generally yes, though the exact figure varies by study and state. Zillow’s widely-cited analysis found a 4.1% average premium, while a more recent 2025 study found 6.9%, with meaningful variation by state in both cases.
For many homeowners, yes, particularly in states with strong net metering and higher electricity rates, though the payback period is longer than it was previously. It’s worth running the numbers for your specific state and utility rather than assuming a blanket national answer.
It’s worth comparing. Since leases and PPAs are owned by a third party who may still access a separate commercial credit, some providers pass part of that savings through as a lower monthly rate, though you won’t build equity in the system the way you would owning it outright.
The Bottom Line
Solar power in 2026 is still a genuinely sound long-term investment for a lot of homeowners, but the math has real changed with the expiration of the federal tax credit. Your actual payback period now depends far more heavily on your state’s net metering policy, electricity rates, and any remaining local incentives than it used to. If you’re planning to stay in your home for the better part of a decade and your state’s policies are favorable, the numbers still work just get a specific, current quote for your situation rather than relying on outdated national averages.
SOURCES
- IRS : “Residential Clean Energy Credit“
- EnergySage : “Federal Solar Tax Credit In 2026: How Does it Work?“
- SolarInfoPath : “2026 Solar Payback Period: 7- vs. 14-Year States”
- This Old House : “Do Solar Panels Increase Home Value?“
- Opendoor : “Do Solar Panels Increase Home Value? Costs, ROI & What Buyers Really Think“
- SolarReviews : “Homes with Solar Sell for 6.9% More [2025 Zillow Data Study]“
DISCLAIMER
PeakGuard Home provides general guidance on home and solar improvement topics based on research and publicly available information. This content is intended for informational purposes only and should not be treated as professional advice. Costs, products, and recommendations may vary based on your location, home, and local codes. Always consult a licensed contractor, electrician, or solar professional before making improvement decisions or starting any project.